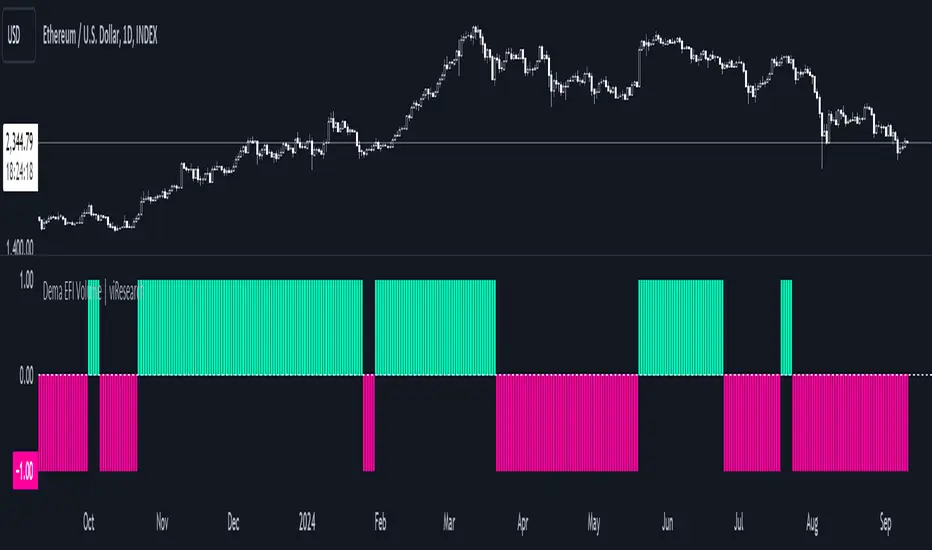
Dema EFI Volume | viResearchDema EFI Volume | viResearch
Conceptual Foundation and Innovation
The "Dema EFI Volume" indicator from viResearch integrates the Double Exponential Moving Average (DEMA) with the Elder Force Index (EFI), providing a dynamic approach to analyzing both price trends and volume strength. The DEMA is applied to smooth out price fluctuations while minimizing lag, which enhances the ability to detect trend direction. The EFI, developed by Dr. Alexander Elder, measures the power behind price movements by incorporating both price change and volume. This indicator, when combined with DEMA smoothing, gives traders a more accurate understanding of whether the current price movements are supported by significant volume, helping them make more informed trading decisions. The combination of DEMA and EFI allows traders to track trend strength while assessing the market’s volume dynamics, offering a more reliable method for identifying potential trend continuations or reversals.
Technical Composition and Calculation
The "Dema EFI Volume" script consists of two key components: the Double Exponential Moving Average (DEMA) and the Elder Force Index (EFI). The DEMA is applied to the selected source price over a user-defined length, providing a smoothed representation of price movements while reducing the noise that can occur with traditional moving averages. The EFI is calculated by multiplying the change in the DEMA by the volume over a user-defined period, which indicates whether the price movement is being driven by strong or weak volume. The script monitors the EFI values and volume data to generate trend signals. If the EFI is positive and volume increases, this indicates bullish pressure, while a negative EFI with decreasing volume suggests bearish conditions. The combination of these signals helps traders determine whether a price move is backed by sufficient volume, making it easier to identify trend continuations or potential reversals.
Features and User Inputs
The "Dema EFI Volume" script offers several customizable inputs, allowing traders to adapt the indicator to their specific strategies. The DEMA Length controls the smoothing applied to the price data, while the EFI Length defines the period over which the force index is calculated. Additionally, traders can set alert conditions for when a bullish or bearish EFI signal occurs, enabling them to react quickly to changing market conditions.
Practical Applications
The "Dema EFI Volume" indicator is designed for traders who want to combine price trend analysis with volume dynamics in a single tool. This makes it particularly effective for identifying trend continuations, as rising volume alongside a positive EFI suggests that the market move is supported by strong momentum. Conversely, decreasing volume and a negative EFI may indicate a weakening trend, giving traders early warning of potential reversals. The combination of DEMA and EFI also makes this indicator valuable for detecting trend strength by measuring whether price movements are backed by strong volume, confirming trend reversals by comparing price changes with volume activity, and improving trade entries and exits by analyzing both price and volume for more robust signals.
Advantages and Strategic Value
The "Dema EFI Volume" script offers significant advantages by combining the DEMA’s smoothing power with the EFI’s volume analysis. This integration allows traders to filter out noise in price data while ensuring that trend signals are backed by meaningful volume. The result is a more reliable tool for trend-following and reversal detection, making it easier for traders to stay aligned with strong market moves while avoiding false signals caused by low-volume fluctuations. The dual focus on price and volume makes the "Dema EFI Volume" an ideal tool for traders who value a comprehensive approach to market analysis.
Alerts and Visual Cues
The script includes alert conditions that notify traders when a significant EFI signal occurs. The "EFI Volume Long" alert is triggered when the EFI is positive and volume increases, indicating a potential upward trend. The "EFI Volume Short" alert signals a possible downward trend when the EFI turns negative and volume decreases. Visual cues, such as the color and direction of the plotted EFI line, help traders quickly identify trend shifts and make timely decisions.
Summary and Usage Tips
The "Dema EFI Volume | viResearch" indicator provides traders with a powerful tool for analyzing both price trends and volume strength. By incorporating this script into your trading strategy, you can improve your ability to detect trend continuations and reversals, making more informed decisions based on a combination of price movement and volume dynamics. Whether you are focused on identifying trend strength or looking for early reversal signals, the "Dema EFI Volume" offers a reliable and customizable solution for traders of all levels.
Note: Backtests are based on past results and are not indicative of future performance.
在腳本中搜尋"Exponential Moving Average"
Super Trend ReversalsMain Concept
The core idea behind the Super Trend Reversals indicator is to assess the momentum of automated trading bots (often referred to as 'Supertrend bots') that enter the market during critical turning points. Specifically, the indicator is tuned to identify when the market is nearing bottoms or peaks, but just before it shifts direction based on the triggered Supertrend signals. This approach helps traders engage with the market right as the reversal momentum builds up, allowing for entry just as conditions become favorable and exit before momentum wanes.
How It Works
The Super Trend Reversals uses multiple Supertrend calculations, each with different period and multiplier settings, to form a comprehensive view of the trend. The total trend score from these calculations is then analyzed using the Relative Strength Index (RSI) and Exponential Moving Averages (EMA) to gauge the strength and sustainability of the trend.
A key feature of this indicator is the isCurrentRangeSmaller() function, which evaluates if the current price range is lower than the average over the recent period. This function is critical as it helps determine the stability of the market environment, reducing the likelihood of entering or exiting trades based on erratic price movements that could lead to false signals.

Harmonic Trend Pulse1. Overview
The Harmonic Trend Pulse Indicator is a technical analysis tool designed for use on price charts. It combines elements of trend detection and harmonic moving averages to provide users with visual insights into market dynamics. The indicator is adaptable to different market conditions and is structured to aid in understanding price movements without making predictions.
2. Key Parameters
The indicator's performance relies on three adjustable settings:
Length: Defines the lookback period used to calculate the midpoint of price movements based on the highest and lowest points within the selected range.
Center: A smoothing parameter that affects how sensitive the trendline is to changes in the market. Higher values lead to a smoother trendline, while lower values make it more reactive.
HMA Length: This is the length for calculating the Harmonic Moving Average (HMA), which is a weighted moving average that helps filter out noise from price data, offering a cleaner view of the underlying trend.
3. Indicator Calculation
The indicator works as follows:
Midpoint Calculation: It first calculates the midpoint of the price using the highest high and lowest low over the given Length. This midpoint is then smoothed using an Exponential Moving Average (EMA) based on the Center value.
Harmonic Moving Average (HMA):
The HMA is calculated by first applying a Weighted Moving Average (WMA) over half the HMA Length and the full HMA Length.
It then computes the final trendline using the HMA formula, which smooths out short-term price fluctuations to provide a more accurate representation of the trend.
4. Visual Interpretation
The indicator plots the HMA trendline on the chart, with its color changing based on the market's direction:
Green Line: Indicates an upward trend when the current HMA value is higher than the previous bar's HMA.
Red Line: Indicates a downward trend when the current HMA value is lower than the previous bar's HMA.
This color-coded visual allows traders to quickly identify the current market trend and assess its strength.
5. Key Benefits
Clear Trend Detection: The combination of trend logic and the harmonic moving average helps users spot market direction changes quickly.
Noise Reduction: The Harmonic Moving Average (HMA) filters out short-term price fluctuations, making it easier to observe the overall trend.
Customizable Parameters: Traders can adjust the Length, Center, and HMA Length settings to tailor the indicator's sensitivity to their preferred trading style.
6. Conclusion
The Harmonic Trend Pulse Indicator provides a flexible and effective tool for tracking market trends. By using a combination of advanced moving averages and trend detection techniques, it offers traders valuable insights into the price dynamics of various assets. Its simple yet powerful visualization helps traders make informed decisions based on current market conditions.

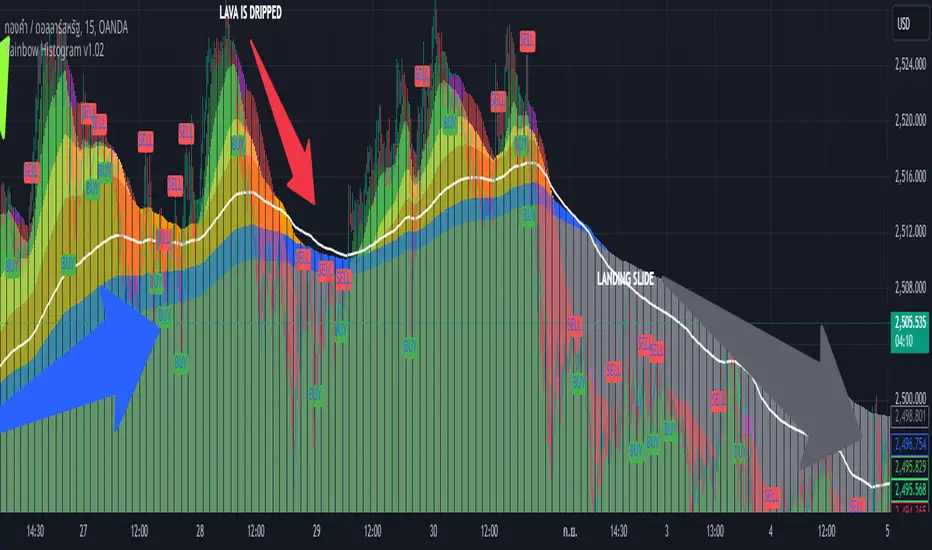
Rainbow Histogram v1.01Sure! Here’s a compelling English version of the article for your TradingView post:
---
### 🌈 **Introducing Rainbow Histogram: A Fusion of EMA and MA for Enhanced Trading Analysis**
**Hello Traders,**
I’m excited to introduce a fresh concept that combines technical analysis techniques into a new indicator called **Rainbow Histogram**. This innovative tool blends Exponential Moving Averages (EMA) and Moving Averages (MA) to provide you with a powerful and accurate tool for making trading decisions.
#### **🎨 What is Rainbow Histogram?**
The Rainbow Histogram is designed to help you identify market trends and signal precise entry and exit points by blending EMA and MA into a colorful "Rainbow" display. This visual approach enhances your ability to spot trend strength and direction with clarity.
#### **📈 How Does Rainbow Histogram Work?**
1. **Exponential Moving Average (EMA):** Captures short-term trends and reacts quickly to price changes.
2. **Moving Average (MA):** Tracks long-term trends and provides a broader view of the market direction.
**Rainbow Histogram** uses the combination of EMA and MA to create a histogram that shows the difference between these two averages in distinct colors. This makes it easy to visualize trend changes and market momentum.
#### **🔧 Setting It Up**
1. **EMA:** Adjust the EMA settings based on your trading timeframe and strategy (e.g., EMA 9, EMA 21).
2. **MA:** Set the MA parameters to capture long-term trends (e.g., MA 50, MA 200).
#### **🌟 Why Use Rainbow Histogram?**
- **Simplified Analysis:** Quickly identify trends and their strength with a clear visual representation.
- **Distinct Colors:** Differentiate between EMA and MA with vibrant colors for easy interpretation.
- **Precise Signals:** Get clear buy and sell signals based on histogram changes.
#### **📥 Get Started**
Add **Rainbow Histogram** to your TradingView charts by searching for the script in TradingView’s library or set it up manually using the recommended settings.
#### **📝 In Summary**
**Rainbow Histogram** is a unique tool that simplifies trend analysis and enhances accuracy by merging EMA and MA into a single, colorful indicator. Use this tool to refine your trading strategy and make more informed financial decisions.
If you have any questions or feedback about **Rainbow Histogram**, feel free to comment below or send me a message!
**Happy Trading!** 🌟
---
I hope this version effectively captures attention and engages your audience!
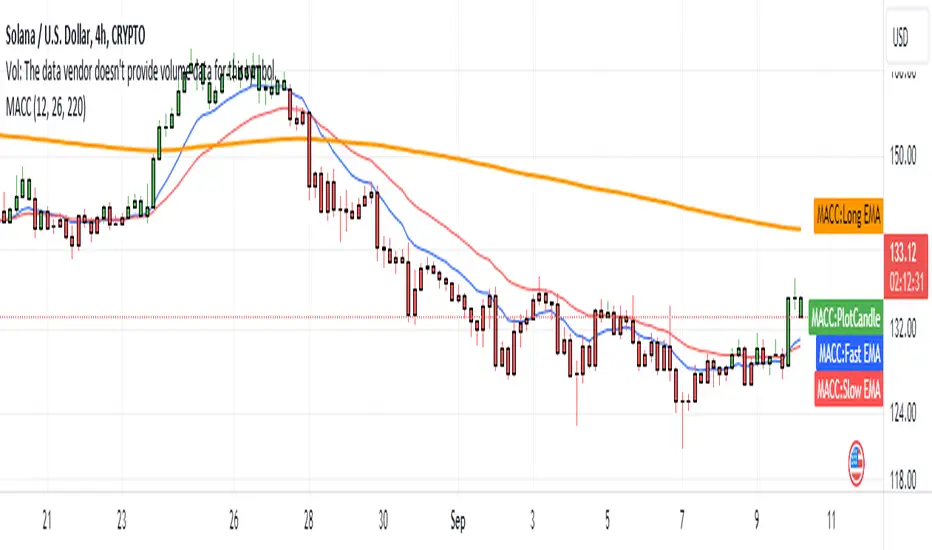
[MACC] Moving Average Candle ColorThe simplest trading framework is using moving average. This indicator is harnessing that very method.
What It Does:
This indicator helps you see market trends at a glance by changing the color of the candlesticks based on the relationship between two Exponential Moving Averages (EMAs). When the 9-period EMA is above the 21-period EMA, candlesticks turn green, suggesting a bullish trend. When the 9 EMA is below the 21 EMA, candlesticks turn red, indicating a bearish trend.
Why You'll Love It:
Easy Trend Visualization: Quickly spot trends and potential reversals with color-coded candlesticks.
Customizable Settings: Adjust the lengths of the EMAs to fit your trading style. Just change the values in the settings panel and watch the indicator update in real-time.
Optional EMA Lines: See the EMA lines plotted on your chart for added context and trend confirmation.
How to Use It:
Green Candlesticks: It’s a sign that the trend is likely upward.
Red Candlesticks: signaling a potential downward trend.
Customization:
EMA Lengths: You can set the lengths for the 9 EMA and 21 EMA to whatever fits your trading strategy best.
Colors: Adjust the colors if you want to match your chart’s theme.
Get Started: Add this indicator to your TradingView chart and tweak the settings to see how it helps you track market trends more effectively.
Cherio...
Bollinger Bands Enhanced StrategyOverview
The common practice of using Bollinger bands is to use it for building mean reversion or squeeze momentum strategies. In the current script Bollinger Bands Enhanced Strategy we are trying to combine the strengths of both strategies types. It utilizes Bollinger Bands indicator to buy the local dip and activates trailing profit system after reaching the user given number of Average True Ranges (ATR). Also it uses 200 period EMA to filter trades only in the direction of a trend. Strategy can execute only long trades.
Unique Features
Trailing Profit System: Strategy uses user given number of ATR to activate trailing take profit. If price has already reached the trailing profit activation level, scrip will close long trade if price closes below Bollinger Bands middle line.
Configurable Trading Periods: Users can tailor the strategy to specific market windows, adapting to different market conditions.
Major Trend Filter: Strategy utilizes 100 period EMA to take trades only in the direction of a trend.
Flexible Risk Management: Users can choose number of ATR as a stop loss (by default = 1.75) for trades. This is flexible approach because ATR is recalculated on every candle, therefore stop-loss readjusted to the current volatility.
Methodology
First of all, script checks if currently price is above the 200-period exponential moving average EMA. EMA is used to establish the current trend. Script will take long trades on if this filtering system showing us the uptrend. Then the strategy executes the long trade if candle’s low below the lower Bollinger band. To calculate the middle Bollinger line, we use the standard 20-period simple moving average (SMA), lower band is calculated by the substruction from middle line the standard deviation multiplied by user given value (by default = 2).
When long trade executed, script places stop-loss at the price level below the entry price by user defined number of ATR (by default = 1.75). This stop-loss level recalculates at every candle while trade is open according to the current candle ATR value. Also strategy set the trailing profit activation level at the price above the position average price by user given number of ATR (by default = 2.25). It is also recalculated every candle according to ATR value. When price hit this level script plotted the triangle with the label “Strong Uptrend” and start trail the price at the middle Bollinger line. It also started to be plotted as a green line.
When price close below this trailing level script closes the long trade and search for the next trade opportunity.
Risk Management
The strategy employs a combined and flexible approach to risk management:
It allows positions to ride the trend as long as the price continues to move favorably, aiming to capture significant price movements. It features a user-defined ATR stop loss parameter to mitigate risks based on individual risk tolerance. By default, this stop-loss is set to a 1.75*ATR drop from the entry point, but it can be adjusted according to the trader's preferences.
There is no fixed take profit, but strategy allows user to define user the ATR trailing profit activation parameter. By default, this stop-loss is set to a 2.25*ATR growth from the entry point, but it can be adjusted according to the trader's preferences.
Justification of Methodology
This strategy leverages Bollinger bangs indicator to open long trades in the local dips. If price reached the lower band there is a high probability of bounce. Here is an issue: during the strong downtrend price can constantly goes down without any significant correction. That’s why we decided to use 200-period EMA as a trend filter to increase the probability of opening long trades during major uptrend only.
Usually, Bollinger Bands indicator is using for mean reversion or breakout strategies. Both of them have the disadvantages. The mean reversion buys the dip, but closes on the return to some mean value. Therefore, it usually misses the major trend moves. The breakout strategies usually have the issue with too high buy price because to have the breakout confirmation price shall break some price level. Therefore, in such strategies traders need to set the large stop-loss, which decreases potential reward to risk ratio.
In this strategy we are trying to combine the best features of both types of strategies. Script utilizes ate ATR to setup the stop-loss and trailing profit activation levels. ATR takes into account the current volatility. Therefore, when we setup stop-loss with the user-given number of ATR we increase the probability to decrease the number of false stop outs. The trailing profit concept is trying to add the beat feature from breakout strategies and increase probability to stay in trade while uptrend is developing. When price hit the trailing profit activation level, script started to trail the price with middle line if Bollinger bands indicator. Only when candle closes below the middle line script closes the long trade.
Backtest Results
Operating window: Date range of backtests is 2020.10.01 - 2024.07.01. It is chosen to let the strategy to close all opened positions.
Commission and Slippage: Includes a standard Binance commission of 0.1% and accounts for possible slippage over 5 ticks.
Initial capital: 10000 USDT
Percent of capital used in every trade: 30%
Maximum Single Position Loss: -9.78%
Maximum Single Profit: +25.62%
Net Profit: +6778.11 USDT (+67.78%)
Total Trades: 111 (48.65% win rate)
Profit Factor: 2.065
Maximum Accumulated Loss: 853.56 USDT (-6.60%)
Average Profit per Trade: 61.06 USDT (+1.62%)
Average Trade Duration: 76 hours
These results are obtained with realistic parameters representing trading conditions observed at major exchanges such as Binance and with realistic trading portfolio usage parameters.
How to Use
Add the script to favorites for easy access.
Apply to the desired timeframe and chart (optimal performance observed on 4h BTC/USDT).
Configure settings using the dropdown choice list in the built-in menu.
Set up alerts to automate strategy positions through web hook with the text: {{strategy.order.alert_message}}
Disclaimer:
Educational and informational tool reflecting Skyrex commitment to informed trading. Past performance does not guarantee future results. Test strategies in a simulated environment before live implementation

SOL & BTC EMA with BTC/SOL Price Difference % and BTC Dom EMAThis script is designed to provide traders with a comprehensive analysis of Solana (SOL) and Bitcoin (BTC) by incorporating Exponential Moving Averages (EMAs) and price difference percentages. It also includes the BTC Dominance EMA to offer insights into the overall market dominance of Bitcoin.
Features:
SOL EMA: Plots the Exponential Moving Average (EMA) for Solana (SOL) based on a customizable period length.
BTC EMA: Plots the Exponential Moving Average (EMA) for Bitcoin (BTC) based on a customizable period length.
BTC Dominance EMA: Plots the Exponential Moving Average (EMA) for BTC Dominance, which helps in understanding Bitcoin's market share relative to other cryptocurrencies.
BTC/SOL Price Difference %: Calculates and plots the percentage difference between BTC and SOL prices, adjusted for their respective EMAs. This helps in identifying relative strength or weakness between the two assets.
Background Highlight: Colors the background to visually indicate whether the BTC/SOL price difference percentage is positive (green) or negative (red), aiding in quick decision-making.
Inputs:
SOL Ticker: Symbol for Solana (default: BINANCE
).
BTC Ticker: Symbol for Bitcoin (default: BINANCE
).
BTC Dominance Ticker: Symbol for Bitcoin Dominance (default: CRYPTOCAP
.D).
EMA Length: The length of the EMA (default: 20 periods).
Usage:
This script is intended for traders looking to analyze the relationship between SOL and BTC, using EMAs to smooth out price data and highlight trends. The BTC/SOL price difference percentage can help traders identify potential trading opportunities based on the relative movements of SOL and BTC.
Note: Leverage trading involves significant risk and may not be suitable for all investors. Ensure you have a good understanding of the market conditions and employ proper risk management techniques.

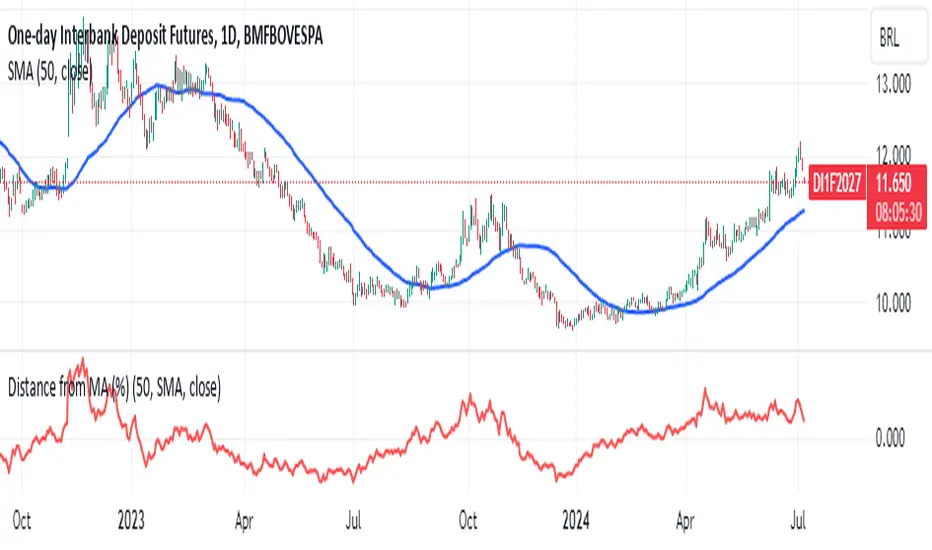
Distance from MA (%)Purpose:
This indicator calculates and plots the distance in percentage between the current price and a specified moving average. The distance is displayed in a separate window below the main price chart.
Features:
Configurable Moving Average Period: You can set the period for the moving average calculation.
Multiple Moving Average Methods: The indicator supports various moving average methods, including Simple Moving Average (SMA), Exponential Moving Average (EMA), Weighted Moving Average (WMA), and Volume Weighted Moving Average (VWMA).
Applied Price Selection: You can choose which price to use for the moving average calculation (e.g., close, open, high, low, etc.).
Parameters:
MA Period: The number of periods to use for the moving average calculation.
MA Method: The type of moving average to use (SMA, EMA, WMA, VWMA).
Applied Price: The price used for the moving average calculation.
Calculation:
Moving Average Calculation:
Depending on the selected method, the indicator calculates the moving average (MA) value for each bar using the specified period and applied price.
Distance in Percentage:
The distance is calculated as the difference between the current price and the moving average value, divided by the moving average value, and then multiplied by 100 to convert it to a percentage.
Formula: Distance %=(Applied Price−MA ValueMA Value)×100Distance %=(MA ValueApplied Price−MA Value)×100
Plotting:
The indicator plots the calculated distance in percentage as a line in a separate window below the main chart. The plot is colored red and has a linewidth of 2 for better visibility.
Supertrend + BB + Consecutive Candles + QQE + EMA [Pineify]Overview
This indicator, developed by Pineify, is a comprehensive tool designed to assist traders in making informed decisions by combining multiple technical analysis methods. It integrates Supertrend, Bollinger Bands (BB), Consecutive Candles, Quantitative Qualitative Estimation (QQE), and Exponential Moving Averages (EMA) into a single, cohesive script. This multi-faceted approach allows traders to analyze market trends, volatility, and potential buy/sell signals with greater accuracy.
Key Features
1. Supertrend: Utilizes the Supertrend indicator to identify the prevailing market trend. It provides clear buy and sell signals based on the direction of the trend.
2. Bollinger Bands (BB): Measures market volatility and identifies overbought or oversold conditions. The script calculates the middle, upper, and lower bands, along with the Bollinger Band Width (BBW) and Bollinger Band %B (BBR).
3. Consecutive Candles: Detects sequences of consecutive bullish or bearish candles, providing signals when a specified number of consecutive candles are detected.
4. Quantitative Qualitative Estimation (QQE): Combines the Relative Strength Index (RSI) with a smoothing factor to generate buy and sell signals based on the QQE methodology.
5. Exponential Moving Averages (EMA): Includes both fast and slow EMAs to identify potential crossovers, which are used as buy and sell signals.
How It Works
- Supertrend: The Supertrend indicator is calculated using a factor and ATR length. It plots the trend direction and generates buy/sell signals when the trend changes.
- Bollinger Bands: The BB indicator calculates the middle band as a Simple Moving Average (SMA) of the closing prices. The upper and lower bands are derived by adding and subtracting a multiple of the standard deviation from the middle band.
- Consecutive Candles: This feature counts the number of consecutive candles that close higher or lower than the previous candle. When the count reaches a specified threshold, it generates a buy or sell signal.
- QQE: The QQE indicator smooths the RSI values and calculates the QQE Fast and QQE Slow lines. Buy and sell signals are generated based on the crossover of these lines.
- EMA: The script calculates fast and slow EMAs and generates buy/sell signals based on their crossovers.
How to Use
1. Inputs: Customize the indicator settings through the input parameters:
- Supertrend Factor and ATR Length
- BB Length
- Consecutive Candles Counting
- QQE RSI Length
- Fast and Slow EMA Lengths
- Enable/Disable Alerts for various signals
2. Alerts: Set up alerts for Supertrend, Consecutive Candles, and EMA crossovers. Alerts can be enabled or disabled based on user preference.
3. Visualization: The indicator plots the Supertrend, Bollinger Bands, and EMA lines on the chart. It also marks buy and sell signals with arrows and labels for easy identification.
Concepts Underlying Calculations
- Supertrend: Based on the Average True Range (ATR) to determine the trend direction and potential reversal points.
- Bollinger Bands: Utilizes standard deviation to measure market volatility and identify overbought/oversold conditions.
- Consecutive Candles: A method to detect momentum by counting consecutive bullish or bearish candles.
- QQE: Enhances the traditional RSI by smoothing it and using a dynamic threshold to generate signals.
- EMA: A widely used moving average that gives more weight to recent prices, making it responsive to market changes.
This indicator is a powerful tool for traders looking to combine multiple technical analysis methods into a single, easy-to-use script. By integrating these diverse techniques, it provides a comprehensive view of market conditions and potential trading opportunities.

VAMSI ADVANCE Entry HelperThe "VAMSI Entry Helper" indicator is designed to assist traders in identifying potential entry points in the market by analyzing price equilibrium and liquidity equilibrium using a combination of Relative Strength Index (RSI) and moving averages. Here’s a detailed description of its components and functionality:
Components of the Indicator:
RSI (Relative Strength Index):
RSI Length: This parameter (rsiLengthInput) controls the period over which the RSI is calculated. It is set to 50 by default, but you can adjust it as needed.
RSI Source: The source of the price data for calculating the RSI, which is the closing price by default.
Moving Average (MA):
MA Type: You can choose between Simple Moving Average (SMA) and Exponential Moving Average (EMA) for smoothing the RSI values.
MA Length: This parameter (maLengthInput) controls the period over which the moving average of the RSI is calculated. It is set to 60 by default.
Functionality:
RSI Calculation:
The script calculates the RSI based on the selected source and length. RSI is a momentum oscillator that measures the speed and change of price movements and oscillates between 0 and 100.
The RSI calculation involves computing the average gains and losses over the specified period (rsiLengthInput), and then applying the RSI formula.
Moving Average of RSI:
After calculating the RSI, the indicator computes a moving average of the RSI values using the specified type (SMA or EMA) and length (maLengthInput). This smoothed RSI helps in identifying the equilibrium of liquidity.
Plots:
RSI Plot: The RSI values are plotted on the chart with a purple line (#4B0082), providing a visual representation of price equilibrium.
MA Plot: The moving average of the RSI is plotted with a black line, showing the smoothed trend of the RSI.
Middle Band: A horizontal line at the 50 level is plotted as a reference point, indicating the midpoint of the RSI scale. This can help in identifying overbought and oversold conditions.
Use Case:
Price Equilibrium: The RSI plot helps traders identify when the price is relatively strong or weak. RSI values above 70 may indicate an overbought condition, while values below 30 may indicate an oversold condition.
Liquidity Equilibrium: The moving average of the RSI provides a smoothed view of the RSI, helping traders see the overall trend of liquidity equilibrium.
Example Usage:
Entry Points: Traders might look for entry points when the RSI crosses above or below its moving average, indicating potential changes in momentum.
Overbought/Oversold Conditions: Traders can use the RSI values along with the middle band (50) to identify overbought (RSI > 70) and oversold (RSI < 30) conditions.
Customization:
RSI Length: Adjustable to fit different trading strategies and timeframes.
Source: You can change the source data for the RSI calculation (e.g., close, open, high, low).
MA Type and Length: You can choose between SMA and EMA and adjust the period to better fit your trading style.
This indicator provides a comprehensive tool for traders to analyze price and liquidity equilibrium, helping them make informed decisions about entry points in the market.

[blackcat] L1 Zero-Lag EMA BandThe Zero-Lag EMA Band is a sophisticated technical analysis tool designed to provide traders with a comprehensive view of market trends. This innovative indicator merges the Zero-Lag EMA, a derivative of the traditional Exponential Moving Average, with Bollinger Bands to create a unique trend indicator that is less laggy and more responsive to market changes.
The Zero-Lag EMA Band is calculated by taking the standard deviation of the price data and adding or subtracting it from the Zero-Lag EMA to create an upper band and a lower band. This process results in a trend band that can help traders identify potential support and resistance levels, providing them with a more accurate assessment of the market's behavior.
The Zero-Lag EMA Band is particularly useful for traders who need to react quickly to market changes. It offers a more timely assessment of potential trend reversals, allowing traders to capitalize on market opportunities and mitigate risk.
The indicator's design is based on the principle of Zero-Lag, which aims to reduce the lag associated with traditional EMAs. This feature makes the Zero-Lag EMA Band a powerful tool for traders who want to stay ahead of the market and make more informed decisions.
In summary, the Zero-Lag EMA Band is a comprehensive and responsive tool for traders looking to identify and capitalize on market trends. It is a valuable addition to any trader's toolkit, offering a more accurate and timely assessment of potential trend reversals and providing a more comprehensive view of the market's behavior.
Certainly! Let's go through the Pine Script code line by line to understand its functionality:
//@version=5
This line specifies the version of Pine Script being used. In this case, it's version 5.
indicator(' L1 Zero-Lag EMA Band', shorttitle='L1 ZLEMA Band', overlay=true)
This line defines the indicator with a title and a short title. The `overlay=true` parameter means that the indicator will be plotted on top of the price data.
length = input.int(21, minval=1, title='Length')
This line creates an input field for the user to specify the length of the EMA. The default value is 21, and the minimum value is 1.
mult = input(1, title='Multiplier')
This line creates an input field for the user to specify the multiplier for the standard deviation, which is used to calculate the bands around the EMA. The default value is 1.
src = input.source(close, title="Source")
This line creates an input field for the user to specify the data source for the EMA calculation. The default value is the closing price of the asset.
// Define the smoothing factor (alpha) for the EMA
alpha = 2 / (length + 1)
This line calculates the smoothing factor alpha for the EMA. It's a common formula for EMA calculation.
// Initialize a variable to store the previous EMA value
var float prevEMA = na
This line initializes a variable to store the previous EMA value. It's initialized as `na` (not a number), which means it's not yet initialized.
// Calculate the zero-lag EMA
emaValue = na(prevEMA) ? ta.sma(src, length) : (src - prevEMA) * alpha + prevEMA
This line calculates the zero-lag EMA. If `prevEMA` is not a number (which means it's the first calculation), it uses the simple moving average (SMA) as the initial EMA. Otherwise, it uses the standard EMA formula.
// Update the previous EMA value
prevEMA := emaValue
This line updates the `prevEMA` variable with the newly calculated EMA value. The `:=` operator is used to update the variable in Pine Script.
// Calculate the upper and lower bands
dev = mult * ta.stdev(src, length)
upperBand = emaValue + dev
lowerBand = emaValue - dev
These lines calculate the upper and lower bands around the EMA. The bands are calculated by adding and subtracting the product of the multiplier and the standard deviation of the source data over the specified length.
// Plot the bands
p0 = plot(emaValue, color=color.new(color.yellow, 0))
p1 = plot(upperBand, color=color.new(color.yellow, 0))
p2 = plot(lowerBand, color=color.new(color.yellow, 0))
fill(p1, p2, color=color.new(color.fuchsia, 80))
These lines plot the EMA value, upper band, and lower band on the chart. The `fill` function is used to color the area between the upper and lower bands. The `color.new` function is used to create a new color with a specified alpha value (transparency).
In summary, this script creates an indicator that displays the zero-lag EMA and its bands on a trading chart. The user can specify the length of the EMA and the multiplier for the standard deviation. The bands are used to identify potential support and resistance levels for the asset's price.
In the context of the provided Pine Script code, `prevEMA` is a variable used to store the previous value of the Exponential Moving Average (EMA). The EMA is a type of moving average that places a greater weight on the most recent data points. Unlike a simple moving average (SMA), which is an equal-weighted average, the EMA gives more weight to the most recent data points, which can help to smooth out short-term price fluctuations and highlight the long-term trend.
The `prevEMA` variable is used to calculate the current EMA value. When the script runs for the first time, `prevEMA` will be `na` (not a number), indicating that there is no previous EMA value to use in the calculation. In such cases, the script falls back to using the simple moving average (SMA) as the initial EMA value.
Here's a breakdown of the role of `prevEMA`:
1. **Initialization**: On the first bar, `prevEMA` is `na`, so the script uses the SMA of the close price over the specified period as the initial EMA value.
2. **Calculation**: On subsequent bars, `prevEMA` holds the value of the EMA from the previous bar. This value is used in the EMA calculation to give more weight to the most recent data points.
3. **Update**: After calculating the current EMA value, `prevEMA` is updated with the new EMA value so it can be used in the next bar's calculation.
The purpose of `prevEMA` is to maintain the state of the EMA across different bars, ensuring that the EMA calculation is not reset to the SMA on each new bar. This is crucial for the EMA to function properly and to avoid the "lag" that can sometimes be associated with moving averages, especially when the length of the moving average is short.
In the provided script, `prevEMA` is used to simulate a zero-lag EMA, but as mentioned earlier, there is no such thing as a zero-lag EMA in the traditional sense. The EMA already has a very minimal lag due to its recursive nature, and any attempt to reduce the lag further would likely not be accurate or reliable for trading purposes.
Please note that the script provided is a conceptual example and may not be suitable for actual trading without further testing and validation.

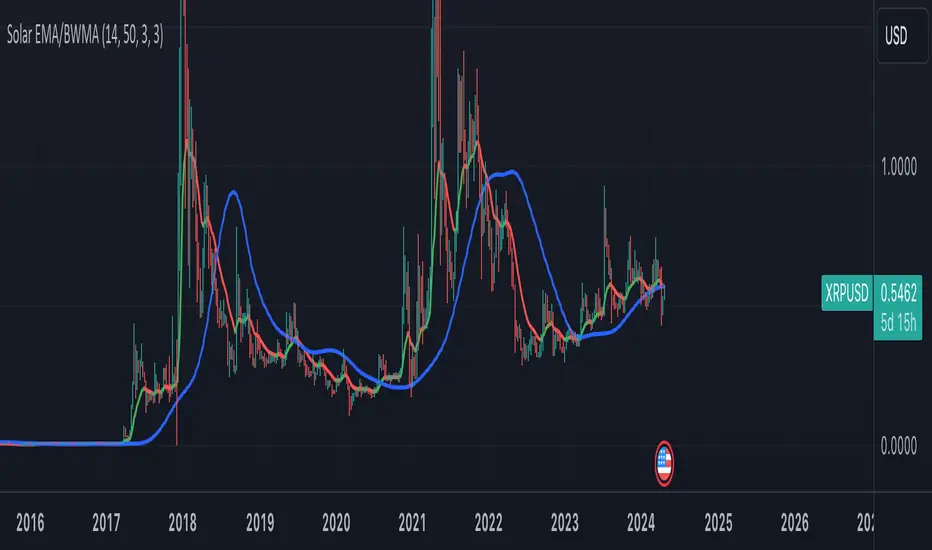
Combined Indicator: Solar EMA and BWMACombined Indicator: Solar EMA and BWMA
This custom indicator combines two popular moving average techniques, the Exponential Moving Average (EMA) and the Barycenter Weighted Moving Average (BWMA), to provide insights into market trends and potential trade opportunities.
Solar EMA (Exponential Moving Average):
The Solar EMA is a dynamic moving average that reacts quickly to price changes while reducing lag.
It is plotted on the chart with customizable lengths, allowing traders to adapt to different market conditions.
Bullish (upward) trends are indicated by a green line, bearish (downward) trends by a red line, and neutral periods by a yellow line.
BWMA (Barycenter Weighted Moving Average):
The BWMA is a weighted moving average that emphasizes recent price action while maintaining smoothness.
It is calculated using a combination of alpha and beta parameters, providing flexibility in tuning to specific market behaviors.
The BWMA line is plotted on the chart, with color indicating trend direction: blue for bullish, red for bearish, and gray for neutral.
Key Features:
Dynamic adaptation to different timeframes, adjusting lengths for both EMA and BWMA based on the selected timeframe.
Detection of potential trend changes and significant market movements using a combination of EMA trend analysis and RSI (Relative Strength Index).
Buy and sell signals generated based on support and resistance levels, providing actionable insights for traders.
Usage:
Traders can use the Solar EMA and BWMA to identify trends, confirm trend reversals, and plan entry and exit points for trades.
Combining both moving averages offers a comprehensive view of market sentiment and enhances decision-making processes.
Disclaimer:
This indicator is intended for educational and informational purposes only and should not be construed as financial advice. Traders are encouraged to conduct their own research and analysis before making any trading decisions.
TASC 2023.11 VAcc█ OVERVIEW
The November 2023 edition of TASC's Traders' Tips features an article titled "VAcc: A Momentum Indicator Based On Velocity And Acceleration" by Scott Cong. This script implements the author's momentum indicator based on simple physics concepts.
█ CONCEPTS
The indicator is named VAcc as it is derived from the average velocity (V) and acceleration (Acc) over a specified lookback period. Consequently, its readings reflect two valuable characteristics of price data: rate (indicating the speed at which the price is moving) and rate of change (indicating whether the price is speeding up or slowing down).
In the article, the author reports that for longer periods, VAcc behaves similarly to the MACD , albeit with a more responsive nature. For shorter periods, VAcc exhibits characteristics reminiscent of the stochastic oscillator , but it trends more prominently and is less prone to overbought/oversold saturation.
To incorporate VAcc into trading strategies, the author suggests considering the following two permutations for the velocity and acceleration data series:
Strong upward condition: Velocity is rising, and acceleration is rising above zero.
Strong downward condition: Velocity is falling, and acceleration is falling.
In the current implementation, the chart displays the average velocity as a line, while the average acceleration is presented as a histogram.
█ CALCULATIONS
The calculation of VAcc involves the following steps:
For the current closing price, C , and for each bar C (i) within a specified lookback period from the current bar, the script calculates velocities, V (i) = ( C - C (i))/i. These velocities are then subjected to an exponential moving average to obtain the smoothed average velocity.
Similarly, for each bar within the lookback period, accelerations are calculated as Acc (i) = ( V - V (i))/i and then averaged without smoothing.

Improved EMA & CDC Trailing Stop StrategyImproved EMA & CDC Trailing Stop Strategy
Objective: This strategy seeks to exploit potential trend reversals or continuations using Exponential Moving Averages (EMAs) and a trailing stop based on the Chande Dynamic Convergence Divergence (CDC) ATR method.
Components:
Exponential Moving Averages (EMAs):
60-period EMA (Blue Line): Faster-moving average that reacts more quickly to price changes.
90-period EMA (Red Line): Slower-moving average that provides a smoother indication of long-term price direction.
MACD Indicator:
Utilized to confirm the trend direction. When the MACD line is above its signal line, it may indicate a bullish trend. Conversely, when the MACD line is below its signal line, it may indicate a bearish trend.
CDC Trailing Stop ATR:
Used to set dynamic stop-loss levels that adjust with market volatility. This stop is based on the Average True Range (ATR) with a user-defined multiplier, providing the strategy with a flexible way to protect against adverse price movements.
Profit Targets:
Based on a multiple of the ATR, this sets an objective level at which to take profits, ensuring gains are captured while potentially still leaving room for further profitable movement.
Trading Rules:
Entry:
Long (Buy) Entry Conditions:
Price is above the 60-period EMA.
The 60-period EMA is above the 90-period EMA.
The MACD line is above its signal line.
Price is above the calculated CDC Trailing Stop ATR level.
Short (Sell) Entry Conditions:
Price is below the 60-period EMA.
The 60-period EMA is below the 90-period EMA.
The MACD line is below its signal line.
Price is below the calculated CDC Trailing Stop ATR level.
Exit:
Long (Buy) Exit Conditions:
Price reaches the predetermined profit target based on the ATR.
Price drops below the CDC Trailing Stop ATR level.
Short (Sell) Exit Conditions:
Price reaches the predetermined profit target based on the ATR.
Price rises above the CDC Trailing Stop ATR level.
Visualization:
The strategy displays the 60-period and 90-period EMAs on the chart.
The CDC Trailing Stop ATR levels for both long and short trades are also plotted for clarity.
The MACD Histogram is shown to visualize the difference between the MACD line and its signal line.
Recommendations: Before deploying this strategy, traders should backtest it across various historical data sets and market conditions. Regularly reviewing and potentially adjusting the strategy is recommended as market dynamics evolve.

Naresh CE with 13 62 crossThank you to Lauris, for sharing knowledge and logic for the EMA cross-over (13/62).
The provided Pine Script is a custom script, which is designed to display Chandelier Exit levels on the price chart and generate buy and sell labels based on specific conditions.
Here's a breakdown of the key components and logic of the Pine Script:
Exponential Moving Averages (EMAs):
ema1: The 13-period Exponential Moving Average (EMA) of the closing price.
ema2: The 62-period Exponential Moving Average (EMA) of the closing price.
EMA Plotting:
The script plots the ema1 (13 EMA) and ema2 (62 EMA) lines on the price chart using the plot() function.
Chandelier Exit Calculation:
The Chandelier Exit values are calculated using the Average True Range (ATR).
The script calculates the atr (Average True Range) using the atr() function with the given length.
longStop is calculated as the highest price of the specified length minus the ATR, and shortStop is calculated as the lowest price plus the ATR.
Directional Indicator (dir):
The dir variable is used to determine the direction of the Chandelier Exit based on the comparison of the current close price with the previous long and short stops.
Buy and Sell Signals:
The script generates buy signals when the Chandelier Exit direction changes from short to long (buySignal).
Similarly, sell signals are generated when the Chandelier Exit direction changes from long to short (sellSignal).
The conditions for buy and sell signals are based on the value of dir and its previous value.
Buy and Sell Labels:
Buy and sell labels are plotted on the chart using plotshape() based on the generated buy and sell signals.
The showLabels input parameter controls whether to display the buy and sell labels.
Highlighting States:
The script fills the chart area with color (green for long, red for short) based on the direction of the Chandelier Exit values.
The highlightState input parameter controls whether to apply this highlighting.
Alerts:
The script includes alert conditions based on the direction change (changeCond), buy signal (buySignal), and sell signal (sellSignal) using the alertcondition() function.
The script aims to help traders identify potential buy and sell signals based on the Chandelier Exit levels derived from the 13 EMA and 62 EMA crossovers. The Chandelier Exit values can serve as dynamic stop-loss levels for long and short positions.

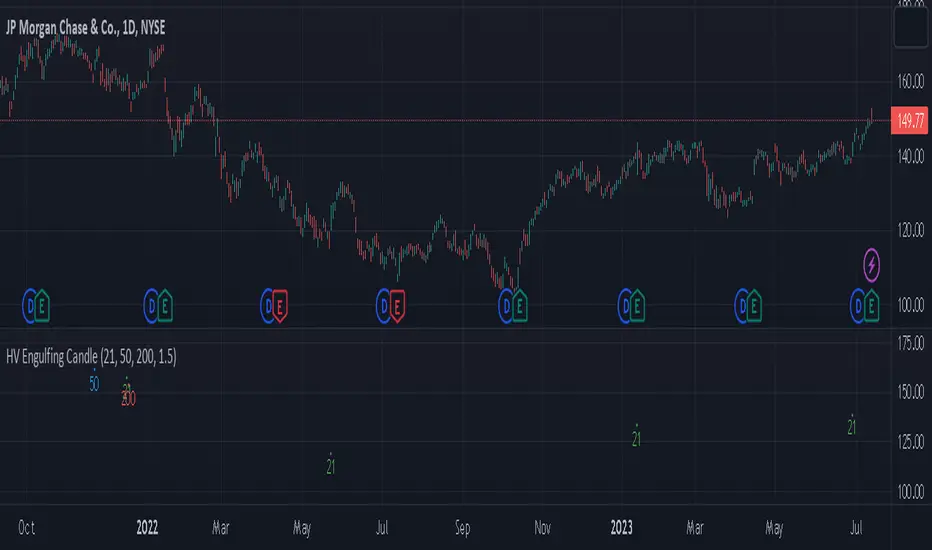
High Volume Engulfing Candle near EMAsThe indicator is designed to identify and signal instances of high volume and engulfing candles near three Exponential Moving Averages (EMAs): the 21EMA, 50EMA, and 200EMA. It can be used in various financial markets such as stocks, forex, commodities, or cryptocurrencies, as long as the market data is available on the TradingView platform.
Here's a breakdown of how the indicator works and its features:
High Volume Detection: The indicator considers a candle to have high volume if its volume is greater than or equal to a specified threshold. The default threshold is set to 1.5 times the 20-period Simple Moving Average (SMA) of the volume. You can adjust the volume_threshold parameter to customize the threshold according to your preferences.
Engulfing Candle Detection: An engulfing candle is identified when the current candle's range engulfs the range of the previous candle. The indicator checks if the current candle is either bullish engulfing (open > close and close > open ) or bearish engulfing (open < close and close < open ). This helps identify significant shifts in market sentiment.
Proximity to EMAs: The indicator checks if the low of the candle is below and the high is above each of the three EMAs (21EMA, 50EMA, and 200EMA). This indicates that the price action is near or interacting with these key moving averages.
When all the following conditions are met, the indicator plots shapes below the candlesticks on the chart to generate signals:
The candle has high volume (volume_threshold).
The candle is an engulfing candle.
The candle's range engulfs the 21EMA, 50EMA, or 200EMA.
The shapes are plotted with different colors and labels to indicate which EMA condition is met. Green shapes represent the 21EMA condition, blue shapes represent the 50EMA condition, and red shapes represent the 200EMA condition.
By using this indicator, traders can potentially identify significant market movements, areas of price interaction with key EMAs, and instances of high volume that may signify strong buying or selling pressure.
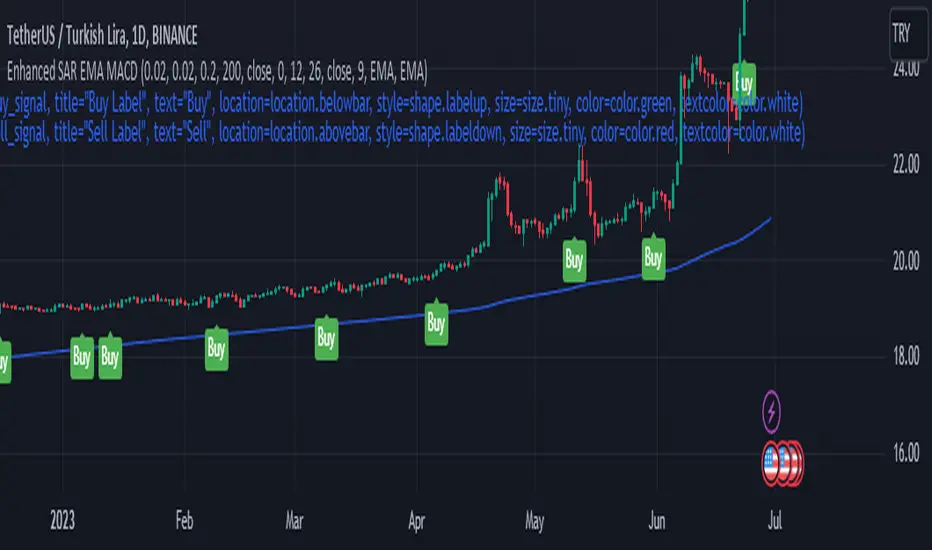
Enhanced Parabolic SAR + EMA 200 + MACD SignalsParabolic SAR + EMA 200 + MACD Signals Indicator is a popular technical analysis tool used by traders to identify potential entry and exit points in the market. It combines three widely used indicators: Parabolic SAR, EMA 200, and MACD.
The Parabolic SAR indicator helps determine potential price reversals. It places dots above or below the price chart to indicate the direction of the trend. When the dots are below the price, it suggests an upward trend, and when they are above the price, it indicates a downward trend.
The EMA 200 (Exponential Moving Average 200) is a moving average that gives more weight to recent price data. It is often used as a significant support or resistance level. Traders consider the price to be in an uptrend if it is above the EMA 200 and in a downtrend if it is below the EMA 200.
The MACD (Moving Average Convergence Divergence) is a trend-following momentum indicator that calculates the difference between two exponential moving averages. It consists of a MACD line and a signal line. When the MACD line crosses above the signal line, it generates a bullish signal, indicating a potential buying opportunity. Conversely, when the MACD line crosses below the signal line, it generates a bearish signal, suggesting a potential selling opportunity.
To use the MACD-Parabolic SAR-EMA200 Indicator for trading, you can follow these guidelines:
Buy conditions:
1. The price should be above the EMA 200.
2. The Parabolic SAR should indicate an upward trend (dots below the price).
3. The MACD delta (the difference between the MACD line and the signal line) should be positive.
Sell conditions:
1. The price should be below the EMA 200.
2. The Parabolic SAR should indicate a downward trend (dots above the price).
3. The MACD delta should be negative.
By combining these three indicators, traders can gain additional confirmation of the overall trend direction and make more informed trading decisions. However, it's important to note that no indicator guarantees successful trades, and it's always advisable to use additional analysis and risk management techniques in conjunction with technical indicators.
Range Weighted Moving Average (RWMA)The Range Weighted Moving Average (RWMA) :
The Range Weighted Moving Average (RWMA) is a variation of the traditional moving average that incorporates the price range within each period as a weighting factor.
It assigns higher weights to periods with larger price ranges, aiming to provide a moving average that responds more dynamically to changes in price range and volatility.
Compared to a normal Simple Moving Average (SMA) or Exponential Moving Average (EMA), the RWMA offers several potential advantages:
Why do i think its better than Normal SMA , EMA ?
Increased Sensitivity: The RWMA reacts faster to changes in price compared to traditional moving averages. By incorporating the price range, which represents the volatility of each period, the RWMA gives more importance to periods with larger price ranges. This increased sensitivity can help traders identify price movements and trends more quickly.
Adaptive to Volatility: The RWMA adjusts dynamically to changes in market volatility. During periods of high volatility, the RWMA places more weight on those periods, capturing and reflecting the increased price movements. This adaptability allows the RWMA to be responsive to different market conditions and better capture significant price swings.
Filtering Potential: The RWMA can be utilized as a filtering tool in trading strategies. By using the RWMA as a trend indicator or filter, traders can focus on trades that align with the direction indicated by the RWMA. This filtering mechanism can help eliminate trades that go against the prevailing momentum, potentially improving the overall quality of trade entries.

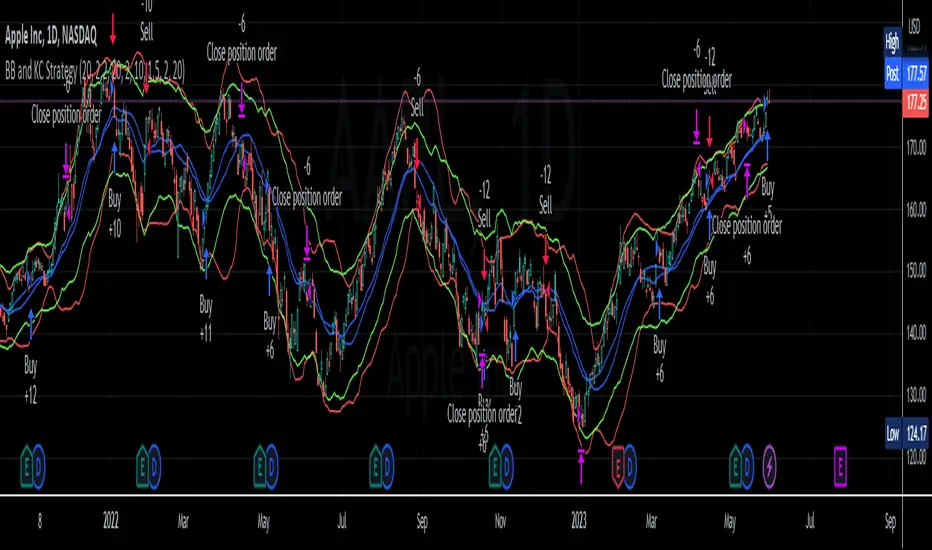
BB and KC StrategyThis script is designed as a TradingView strategy that uses Bollinger Bands (BB) and Keltner Channels (KC) as the primary indicators for generating trade signals. It aims to catch potential market trends by comparing the movements of these two popular volatility measures.
Key aspects of this strategy:
1. **Bollinger Bands and Keltner Channels:** Both are volatility-based indicators. The Bollinger Bands consist of a middle band (simple moving average) and two outer bands calculated based on standard deviation, which adjusts itself to market conditions. Keltner Channels are a set of bands placed above and below an exponential moving average of the price. The distance between the bands is calculated based on the Average True Range (ATR), a measure of price volatility.
2. **Entry Signals:** The strategy enters a long position when the upper KC line crosses above the upper BB line and the volume is above its moving average. Conversely, it enters a short position when the lower KC line crosses below the lower BB line and the volume is above its moving average.
3. **Exit Signals:** The strategy exits a position under two conditions. First, if the trade has been open for a certain number of bars defined by the user (default 20 bars). Second, a stop loss and trailing stop are in place to limit potential losses and lock in profits as the price moves favorably. The stop loss is set at a percentage of the entry price (default 1.5% for long and -1.5% for short), and the trailing stop is also a percentage of the entry price (default 2%).
4. **Trade Quantity:** The script allows specifying the investment amount for each trade, set to a default of 1000 currency units.
Remember, this is a strategy script, which means it is used for backtesting and not for real-time signals or live trading. It is also recommended that it is used as a tool to aid your trading, not as a standalone system. As with any strategy, it should be tested over different market conditions and used in conjunction with other aspects of technical and fundamental analysis to ensure robustness and effectiveness.
AggBands (v1) [qrsq]The "AggBands" indicator is a custom trading indicator designed to provide a consolidated view of the price action across multiple assets or trading pairs. It combines the price data from multiple tickers and calculates an aggregated price using user-defined weights for each ticker.
The indicator starts by defining the tickers to be included in the aggregation. You can choose from predefined configurations such as "BTC PAIRS," "CRYPTO TOTAL MARKET CAP," "TOP 5 PAIRS," "TOP 5 MEMECOINS," "SPX," "DXY," or "FANG." Each configuration includes specific tickers or indices relevant to the chosen category.
The indicator then fetches the closing, high, and low prices for each ticker and applies the user-defined weights to calculate the aggregated prices. The aggregated prices are normalized within a specified length to provide a consistent scale across different assets or pairs.
Next, the indicator calculates the midpoint, which is the average of the highest high and lowest low of the aggregated prices over a specified aggregation period.
To assess the volatility, the indicator calculates the price range and applies the Average True Range (ATR) indicator to determine the volatility value. The standard deviation is then computed using the price range and aggregation period, with an additional scaling factor applied to the volatility value.
Based on the standard deviation, the indicator generates multiple bands above and below the midpoint. By default, three standard deviation bands are calculated, but the user can choose between one and five bands. The upper and lower bands are smoothed using various moving average (MA) types, such as Simple Moving Average (SMA), Exponential Moving Average (EMA), Smoothed Moving Average (SMMA/RMA), Weighted Moving Average (WMA), Volume Weighted Moving Average (VWMA), Volume Weighted Average Price (VWAP), or Arnaud Legoux Moving Average (ALMA). The user can also adjust the length, offset, and sigma parameters for the moving averages.
The indicator can optionally smooth the midpoint, upper bands, and lower bands using a separate set of moving average parameters.
The indicator can be useful for traders and analysts who want to gain a consolidated view of price movements across multiple assets or trading pairs. It helps identify trends, volatility, and potential support and resistance levels based on the aggregated price and standard deviation bands. Traders can use this information to make informed decisions about trading strategies, risk management, and market analysis.

Volatility Compression BreakoutThe Volatility Compression Breakout indicator is designed to identify periods of low volatility followed by potential breakout opportunities in the market. It aims to capture moments when the price consolidates within a narrow range, indicating a decrease in volatility, and anticipates a subsequent expansion in price movement. This indicator can be applied to any financial instrument and timeframe.
When the close price is above both the Keltner Middle line and the Exponential Moving Average (EMA), the bars are colored lime green, indicating a potential bullish market sentiment. When the close price is positioned above the Keltner Middle but below the EMA, or below the Keltner Middle but above the EMA, the bars are colored yellow, signifying a neutral or indecisive market condition. Conversely, when the close price falls below both the Keltner Middle and the EMA, the bars are colored fuchsia, suggesting a potential bearish market sentiment.
Additionally, the coloration of the Keltner Middle line and the EMA provides further visual cues for assessing the trend. When the close price is above the Keltner Middle, the line is colored lime green, indicating a bullish trend. Conversely, when the close price is below the Keltner Middle, the line is colored fuchsia, highlighting a bearish trend. Similarly, the EMA line is colored lime green when the close price is above it, representing a bullish trend, and fuchsia when the close price is below it, indicating a bearish trend.
Parameters
-- Compression Period : This parameter determines the lookback period used to calculate the volatility compression. A larger value will consider a longer historical period for volatility analysis, potentially capturing broader market conditions. Conversely, a smaller value focuses on more recent price action, providing a more responsive signal to current market conditions.
-- Compression Multiplier : The compression multiplier is a factor applied to the Average True Range (ATR) to determine the width of the Keltner Channels. Increasing the multiplier expands the width of the channels, allowing for a larger price range before a breakout is triggered. Decreasing the multiplier tightens the channels and requires a narrower price range for a breakout signal.
-- EMA Period : This parameter sets the period for the Exponential Moving Average (EMA), which acts as a trend filter. The EMA helps identify the overall market trend and provides additional confirmation for potential breakouts. Adjusting the period allows you to capture shorter or longer-term trends, depending on your trading preferences.
How Changing Parameters Can Be Beneficial
Modifying the parameters allows you to adapt the indicator to different market conditions and trading styles. Increasing the compression period can help identify broader volatility patterns and major market shifts. On the other hand, decreasing the compression period provides more precise and timely signals for short-term traders.
Adjusting the compression multiplier affects the width of the Keltner Channels. Higher multipliers increase the breakout threshold, filtering out smaller price movements and providing more reliable signals during significant market shifts. Lower multipliers make the indicator more sensitive to smaller price ranges, generating more frequent but potentially less reliable signals.
The EMA period in the trend filter helps you align your trades with the prevailing market direction. Increasing the EMA period smoothes out the trend, filtering out shorter-term fluctuations and focusing on more sustained moves. Decreasing the EMA period allows for quicker responses to changes in trend, capturing shorter-term price swings.
Potential Downsides
While the Volatility Compression Breakout indicator can provide valuable insights into potential breakouts, it's important to note that no indicator guarantees accuracy or eliminates risk. False breakouts and whipsaw movements can occur, especially in volatile or choppy market conditions. It is recommended to combine this indicator with other technical analysis tools and consider fundamental factors to validate potential trade opportunities.
Making It Work for You
To maximize the effectiveness of the Volatility Compression Breakout indicator, consider the following:
-- Combine it with other indicators : Use complementary indicators such as trend lines, oscillators, or support and resistance levels to confirm signals and increase the probability of successful trades.
-- Practice risk management : Set appropriate stop-loss levels to protect your capital in case of false breakouts or adverse price movements. Consider implementing trailing stops or adjusting stop-loss levels as the trade progresses.
-- Validate with price action : Analyze the price action within the compression phase and look for signs of building momentum or weakening trends. Support your decisions by observing candlestick patterns and volume behavior during the breakout.
-- Backtest and optimize : Test the indicator's performance across different timeframes and market conditions. Optimize the parameters based on historical data to find the most suitable settings for your trading strategy.
Remember, no single indicator can guarantee consistent profitability, and it's essential to use the Volatility Compression Breakout indicator as part of a comprehensive trading plan. Regularly review and adapt your strategy based on market conditions and your trading experience. Monitor the indicator's performance and make necessary adjustments to parameter values if the market dynamics change.
By adjusting the parameters and incorporating additional analysis techniques, you can customize the indicator to suit your trading style and preferences. However, it is crucial to exercise caution, conduct thorough analysis, and practice proper risk management to increase the likelihood of successful trades. Remember that no indicator can guarantee profits, and continuous learning and adaptation are key to long-term trading success.

Colored Moving Averages With Close Signals[Whvntr][TradeStation]Plots the first time the close price is above or below the colored portion of the chosen MA. The MA's formula is from TradeStation's indicator: "Colored Moving Averages Can Help You Spot Trends" . I modified that indicator with customizations that include: Buy and Sell signals. Each time the current bar closes above the MA, while it's red (bearish), there's a Sell label at the start of that MA trend. Likewise: each time the current bar closes below the MA, while it's white (bullish), there's a Buy label at the beginning of that MA trend. You can now, also, easily see which MA you are selecting by hovering your cursor over the tooltips icon. I've included a modified Hull MA as default because I've found this SMA combination with the WMA to be a very smooth oscillation. I've also added some different types of MA's. Colored moving averages are helpful to determine when a trend may be reversing.
MA's
1 · Modified Hull MA: (SMA of the WMAs Hull Formula)
2 · Hull MA
3 · Exponential Moving Average
4 · Weighted Moving Average
5 · RMA Moving Average used in RSI
6 · Volume Weighted MA
7 · Simple Moving Average
This indicator isn't endorsed as a guarantee of future, favorable, results.
Big Poppa Code Strat & Momentum Strategy IndicatorThis indicator is a combination of a few things in order to work with a unique trading style gleaned from Callme100k, jrgreatness, TrustMyLevels , FaithInTheStrat, Rob Smith and Saty Mahajan.
This Indicator is created to help you day trade using, ATR Fibonacci Levels, Price Action and Momentum.
It displays Fibonacci Levels Based on ATR to indicate when a security is 0.236, 0.382 +- the Days Open, +- the Days Open, 0.618 +- the Days Open and 1.0 +- Days Open.
To understand this script you need to understand
Average True Range (ATR)
1 Bar Inside Bar
2 Bar Outside Bar (Break either the top or bottom)
3 Bar Engulfing Bar
Strat Setups - 212, 322, 312
Fibonacci - 0.236, 0.382, 0.618, 1.0
Moving Averages
A Trend is considered bullish when (green)
Current Price is greater than the Fast EMA Value (8)
Fast EMA is greater than PIVOT EMA Value (21)
Pivot EMA is greater than SLOW EMA Value (34)
OR Hull is trending up and the Price is above the Volume Weighted Moving Average and price is above VWAP
A trend is considered Bearish when (red)
Current Price is less than the Fast EMA Value (8)
Fast EMA is less than PIVOT EMA Value (21)
Pivot EMA is less than SLOW EMA Value (34)
OR Hull is trending down and the Price is below the Volume Weighted Moving Average and price is below VWAP
If these conditions are not met then the Momentum is in Conflict (orange)
The Momentum band will match the color of the current trend
The table that is present can be turned off at any time lets you see
1) If Moving Averages are showing bullish, bearish or in conflict
2) If There us Time Frame Continuity, (if 5 min up, are all the other timeframes up also)
3) How much of the ATR have we moved on the day
4) Are we in Call or Put range for the day based on ATR Fib Levels
The Ideal situation for entering a call
1) Momentum is Green
2) FTFC on Green
3) A Strat Actionable Signal is present
4) You are in the call range, 0.236 - 0.618 ATR + the Price
5) The ATR still has room, I.e only 50% of the ATR has been run already
Ideal situation from entering a put
1) Momentum is red
2) FTFC on Red
3) A Strat Actionable Signal is present
4) You are in the put range, 0.236 - 0.618 ATR - the Price
5) The ATR still has room, I.e only 50% of the ATR has been run already
Exit the trade for these reasons you entered (for profit or loss)
1) ATR has no more room
2) FTFC is now in conflict
3) Momentum has shifted
Take Profit when
1) You reach a new ATR Level 0.618, 1.0 , -0.618, -1, etc
Passive Stop Loss
1) Open Price if you are aggressive
2) Next ATR Level Down or Up
Feel free to take profit and leave runners
This script does not give signals, you should do your own research, I am not a financial advisors, I am simply applying principles of seasoned veterans to code. You make all decisions about how you buy, sell and trade. The creator of this script makes no promises and takes no responsibility for your personal trading.
To research the methods described above look up
Rob Smith : The Strat
Saty Mahajan : ATR Levels
Fibonacci
Using the HULL Moving Average
Exponential Moving Averages
VWAP
VWMA
